San Francisco Neighborhood Values
The general market dynamics in November were little changed from October, so for a different perspective, below are long-term trends in average sales prices and average dollar-per-square-foot values in a variety of areas around the city. The last sales period assessed on the charts is made up of the three months September through November; the neighborhoods chosen were picked for their high volume of sales for the property type being tracked -- generally speaking, the greater the volume of sales, the more reliable the statistics. Pretty much all areas of San Francisco are now showing the same general trend line, a distinct and substantial recovery in values, though some neighborhoods began their recovery earlier in the year and have seen greater increases year to date.
If you'd like to review the overall real estate market dynamics of San Francisco -- months supply of inventory, days on market, the number of new listings coming on market, percentage of listings accepting offers, and so on -- these can be found online here: SF December Market Report.
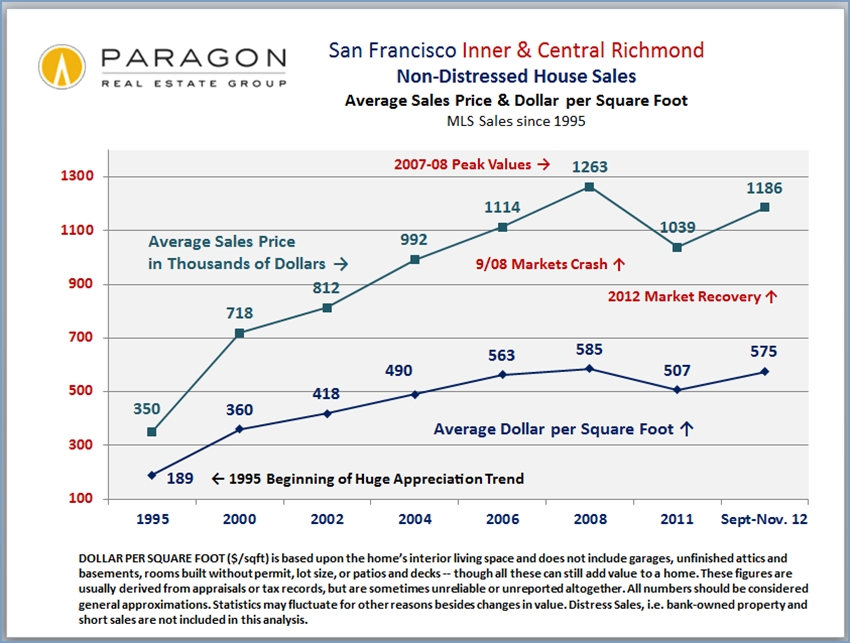
 Inner & Central Richmond House Values
House sales here over the past three months had an average sales price of $1,186,000 at an average of $575 per square foot. Compared to 2011, those figures reflect a 13% to 14% increase.
Central & Outer Sunset & Parkside
 Bernal Heights House Values
With an average sales price of $896,000 and a distressed home market that has basically disappeared, the Bernal Heights averages are up about 19% from the bottom of the market in 2011. And getting very close to the previous peak in values in 2007.

Noe & Eureka Valley House Values
Average house sales price in this extremely hot market area was $1,665,000 in the past 3 months, which is actually higher than previous peak values in 2008. However, we'll have to wait to see what occurs over the longer trend since seasonality is one of the factors in prices. Average dollar per square foot is still somewhat below the 2008 peak.
 Noe, Eureka & Cole Valleys: Condo Values
Condo values in these highly sought after Upper-Market neighborhoods have followed a similar trajectory. The average condo sales price here over the past 3 months was $1,000,000.
Prestige Northern Neighborhoods
The most expensive area for houses in San Francisco is in the northern band of old-prestige neighborhoods running from Telegraph Hill in the east to Sea Cliff in the west. As the luxury market has rebounded in a big way in 2012, we've seen increases in value in the 18% to 20% range since the market bottom in 2010.
 South Beach - Yerba Buena Condo Values
The greater South Beach area has seen a rebound in condo values in the 15% to 20% range. This area has some of the most expensive condos in the city, many featuring spectacular views.
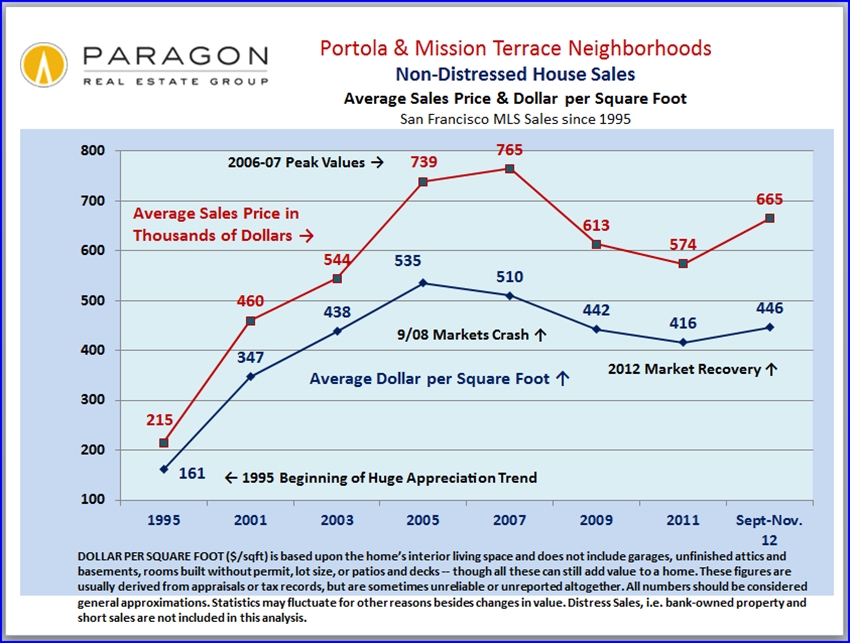
 Portola & Mission Terrace House Values
The southern-most neighborhoods of San Francisco were those hit hardest by the distressed sale crisis. But the distressed property market is rapidly dwindling here and prices have been rebounding dramatically in the past 6 months. The recovery here started a step behind the recoveries in the most affluent neighborhoods, but is now accelerating rapidly.
 Pacific Heights-Marina Condo Values
At $1,235,000, the average condo sales price in the neighborhoods of Pacific & Presidio Heights, Cow Hollow and the Marina is now back up to the previous peak-value level of 2008. While the condos in South Beach have all been built in the last 15 years or so, condos in these older prestige neighborhoods are in buildings typically built 70 - 100 years ago.
Contact me anytime for assistance, information and resources regarding living in San Francisco.
Statistics are generalities and should be considered approximations -- the longer term trend is more important than monthly fluctuations. Average sales price and average dollar per square foot trends may be affected by a wide variety of factors -- seasonality, buying trends, availability of financing, inventory -- and how they apply to any specific property is unknown. Property livable square footage, upon which average dollar per square foot is calculated, is often measured in different ways, taken from unreliable records or unreported altogether.
All data herein is derived from sources deemed reliable, but may contain errors and omissions, and is subject to revision.
© Paragon Real Estate Group