Case-Shiller: Different Bubbles, Different Accelerating Recoveries
When the market fell from its peak in 2006-early 2008 (different areas and different market segments peaked at different times), the scale of the decline varied widely, mostly by price point. With the recovery that began in 2012 and accelerated in 2013, the magnitude of the price recovery, as compared to previous peak values, has also varied by price point and area. The lowest price range (terribly affected by foreclosures and distressed sales) fell most dramatically – approximate 60% decline – and though recovering dramatically on a percentage basis, is still way below its peak. It simply has much more loss to make up.
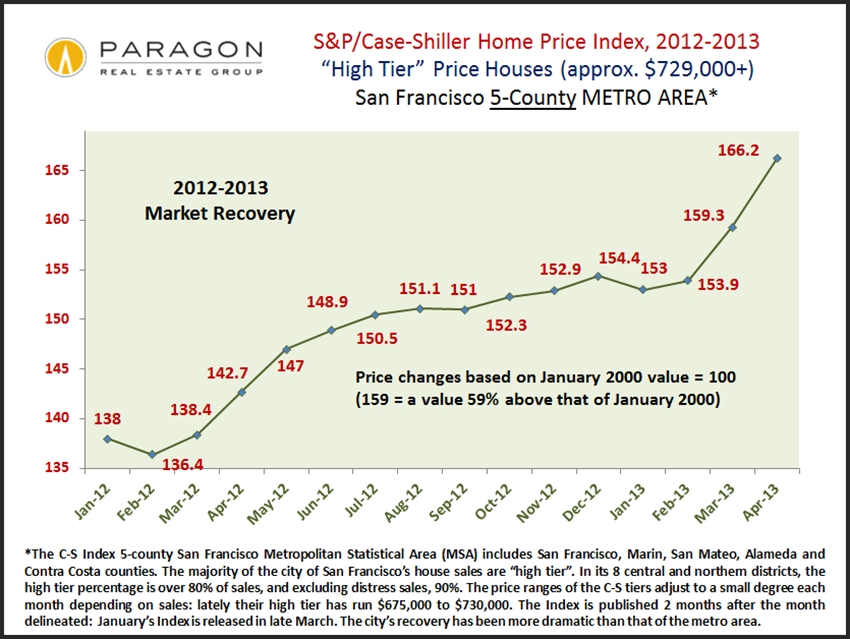
The upper price range (the top third of unit sales) in the 5-county metro area fell much less during the bubble pop and with the recovery is getting close again to peak values:
This chart below illustrates the short-term changes in the C-S high tier index: the recovery in 2012 accelerating in 2013:
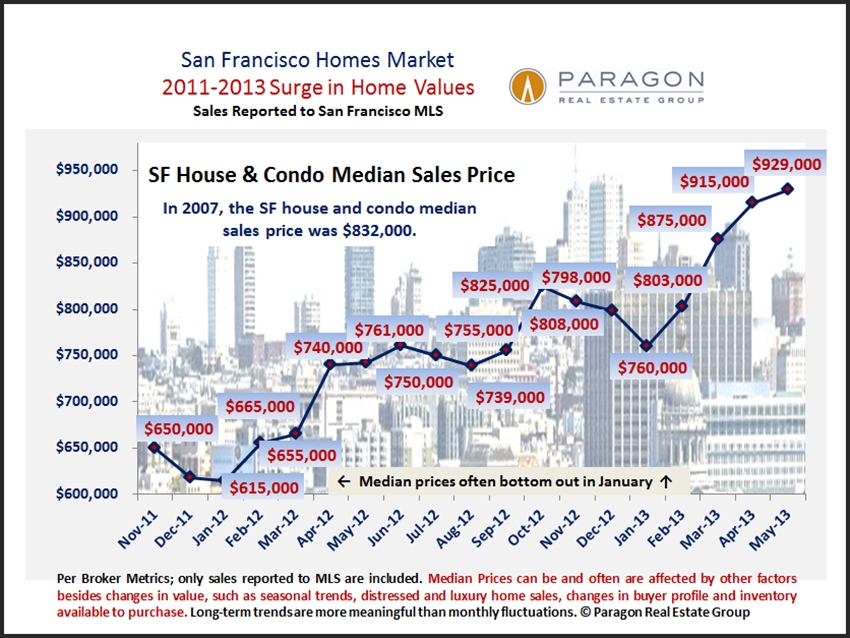
And then looking just at the city of San Francisco itself, which has, generally speaking, among the highest home prices in the 5-county metro area: many of its neighborhoods are now blowing past previous peak values. Note that this chart has more recent price appreciation data than available in the Case-Shiller Indices and that the rate of appreciation accelerated in the March-May timeframe. This is also for both houses and condos combined, when the C-S charts used above are for house sales only.
Note: Case-Shiller Home Price Indices for “San Francisco” are for a 5-county area, of which the city’s housing market is a very small part. Since they are published 2 months after the month of the Index, are 3-month rolling averages, and the time between offer acceptance and closed sale typically runs 4-8 weeks, Case-Shiller is generally 3-6 months behind the market itself, i.e. when offers are being negotiated in the present. Case-Shiller publishes 4 main indices for SF Metro Area houses: an aggregate index for all price ranges, and then one index for each third of unit sales - low price, middle price and high price tiers.


