Recovery - Year Three
Three Years into the Market Recovery - San Francisco Real Estate as 2015 Begins
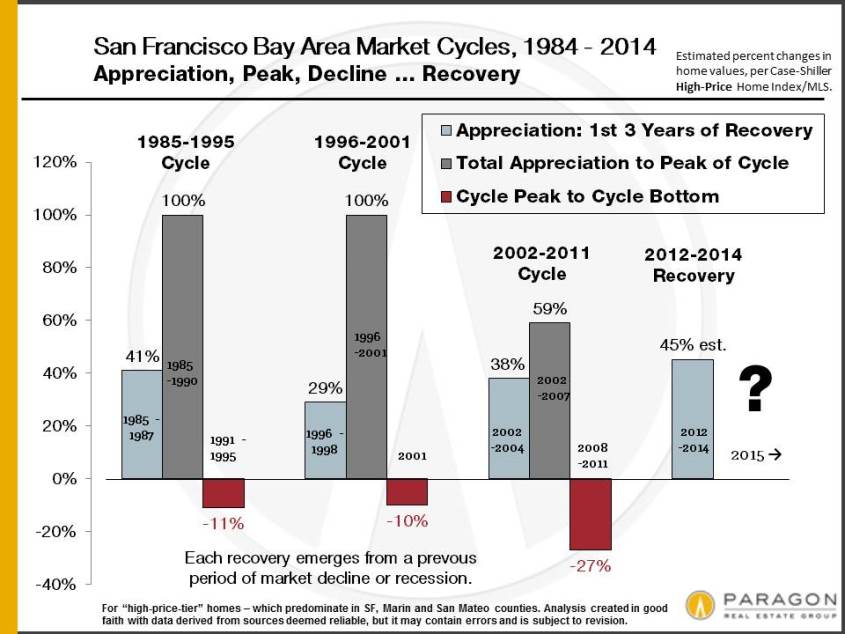
The 2 charts above look at the last 30 years of real estate cycles, and also compare percentage appreciation during the first 3 years of recent market recoveries (the light blue columns in the 2nd chart). Appreciation since 2012 has occurred somewhat faster than the other recoveries since 1980, but it is also coming off a much larger crash than earlier cycles. Typically, recoveries, and the upswings in appreciation they engender, have lasted 5 to 7 years – which is no guarantee how our current cycle will play out.
The chart below graphs the quarterly path of median house price appreciation in San Francisco since 2012, illustrating shorter-term seasonal cycles. Condo prices in the city followed a similar trajectory, though at somewhat lower values: In the latest quarter, the median condo sales price was just the tiniest bit under $1 million.


