Noe / Eureka / Cole Valley District Update
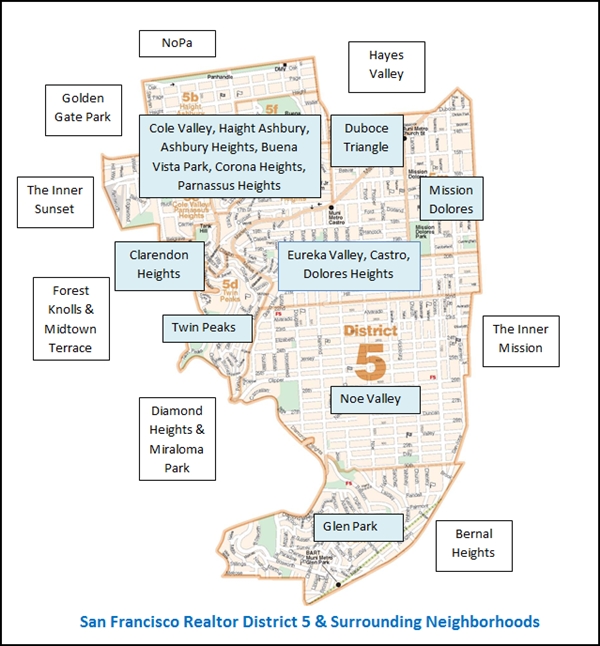
District 5 is one of the more homogeneous districts in San Francisco in terms of property values, but still any analysis of an area with so many properties of different type, location, condition and quality can only be a very general overview.
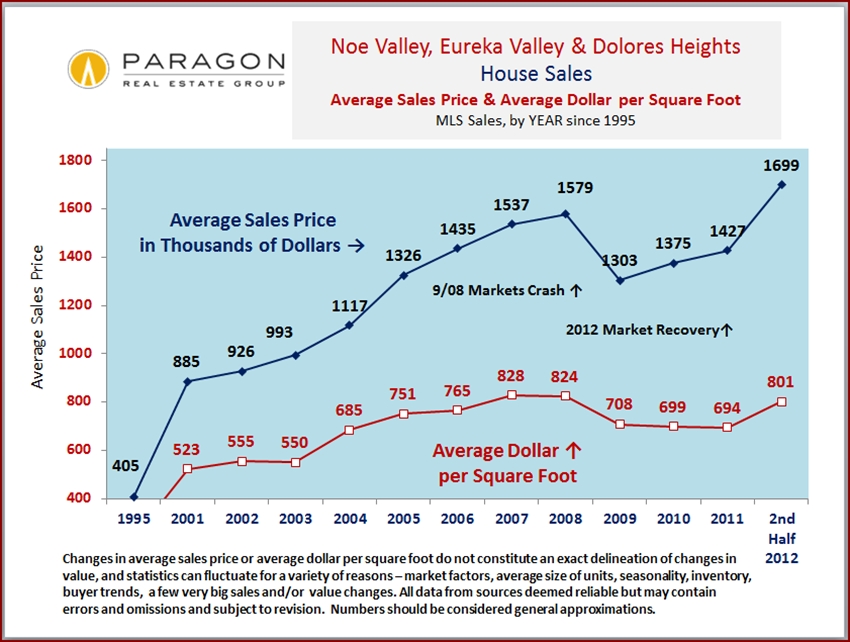
District 5 soared in value between 1996 and 2008 and was one of the last districts to peak in value before the financial markets meltdown in September 2008. Values then fell 15% to 20% very quickly and then stabilized in 2009 and 2010. With the surge in high-tech buyers in 2011 (among other economic factors), many of whom wish to be close to highways to the peninsula -- and love the lifestyle and ambiance of District 5 neighborhoods and its commercial districts -- activity in this district picked up dramatically.
 In 2012, the competition between qualified, motivated buyers here became ferocious: inventory is very low, certainly not enough to satisfy buyer demand, and many of the listings are selling very quickly in multiple-offer, competitive-bidding situations. This is exerting considerable upward pressure on prices.
Since opening our doors in 2004, Paragon has represented buyers and sellers in over 1500 transactions totaling $1.7 billion in sales in District 5, making us 1 of the top 2 brokers in these neighborhoods we know and love so well.
Homes Selling Over, Under and At List Price
One of the clearest indications of the extraordinary heat of the market in these central city neighborhoods is the huge percentage of listings selling for over asking price, and often far over asking price: 1 in 4 home listings that sell is closing for 10% or more over the list price.
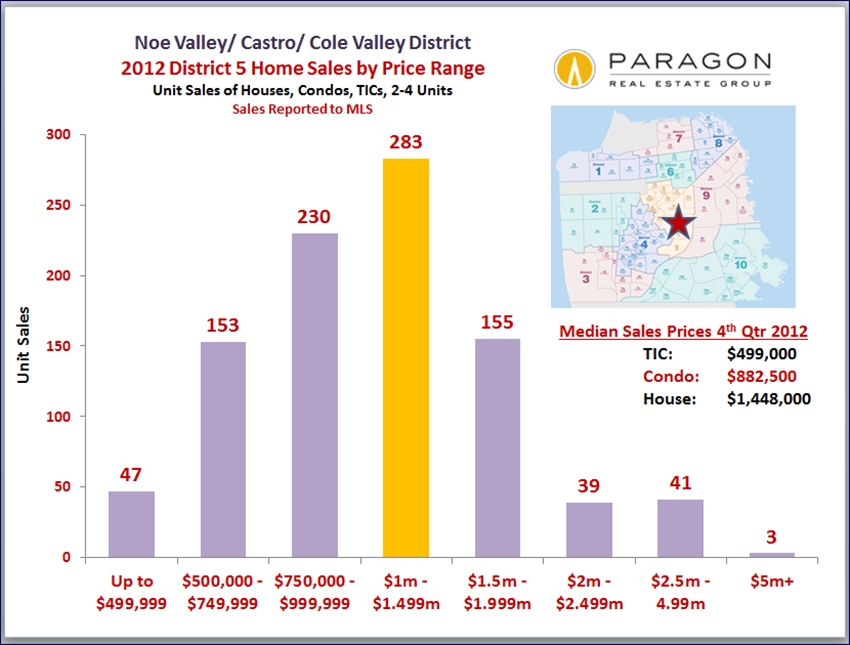
Home Sales by Price Range A snapshot of number of sales by price segment in 2012.
Average Sales Prices & Average Dollar per Square Foot The two statistics of value in the charts following -- average sales price and average dollar per square foot -- can change depending on a number of market factors, but the general price trend over the past year or so is clearly upward. High demand plus low supply equals higher prices. When neighborhoods are grouped together below, it is because they generally share similar market values in particular property types. Annual statistics, because of the much greater amount of data, are typically more reliable than (fluctuating) quarterly or monthly stats, however when a market is changing quickly, as it has in 2012, annual data will minimize market changes (which is why the charts show statistics from the latter part of the past year).
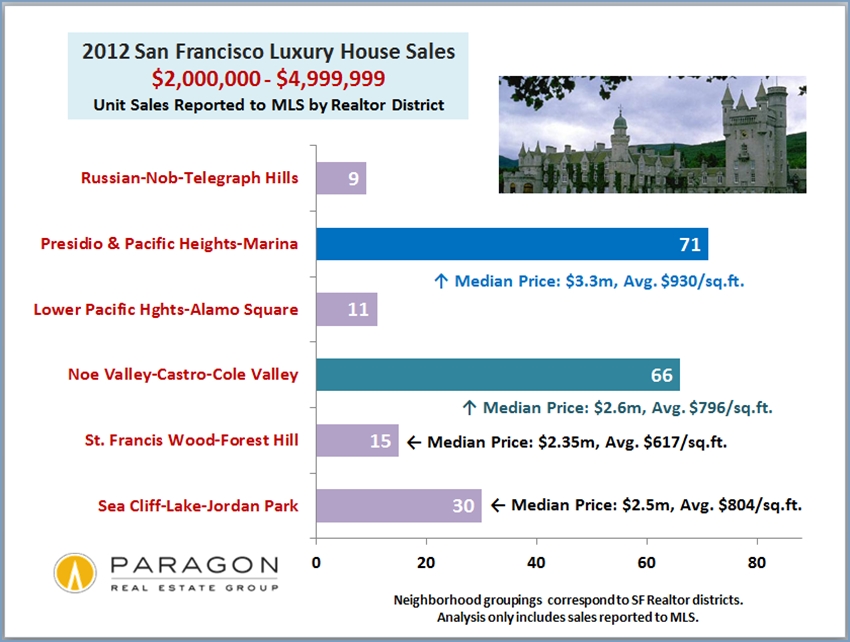
Luxury Home Sales Higher end home sales in the Noe Valley, Eureka Valley, Cole Valley and associated neighborhoods of Realtor District 5 dramatically surged in 2012. Though prices are still significantly lower than in the old-prestige, northern neighborhoods such as Pacific and Presidio Heights, this area is playing a greater and greater role in luxury home segment. High-tech buyers are definitely playing a major role in this dynamic.
All data from sources deemed reliable, but may contain errors and subject to revision. Copyright Paragon Real Estate Group


