Default Fears Affect October Market
Mixed Signals from San Francisco Homes Market
The number of home listings accepting offers was way down in October (when it usually goes up); months-supply-of-inventory was significantly up (when it usually goes down in October); average days-on-market were still very low; median sales price was generally stable: The San Francisco real estate market is currently delivering a wide variety of signals, some of them undoubtedly influenced by the U.S. government shutdown fiasco.
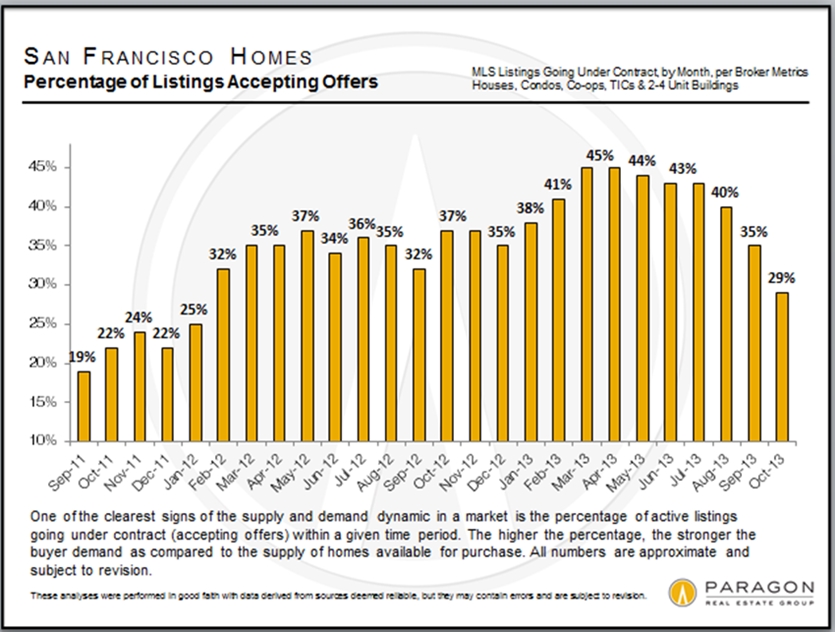
Percentage of Listings Accepting Offers
October is usually one of the busiest months of the year for buyers purchasing new homes – as measured by having their offers accepted – as they react to the surge of new listings that typically arrives after Labor Day. But the government shutdown and the threat of U.S. default hammered October’s activity as SF buyers nervously waited to see how it was going to shake out. Surveys show that the affluent were the group most concerned about a possible default – and SF is a very affluent home-buying market. In this chart, the plunge in the percentage of listings accepting offers is well illustrated; and on a unit basis, the number of homes accepting offers dropped by about 20% year over year, a big decline. Closed sales were actually up about 7%, but October closings reflect accepted offer activity in August/ September before the shutdown crisis began. It is too early to tell if there is more going on in the market besides the temporary reaction to default fears.
Average Days on Market
Although many fewer listings went into contract (i.e. accepted offers) in October compared to last year, those homes that didaccept offers did so, on average, very quickly. That, of course, is usually an indication of a hot market. So buyers didn’t snap up as many listings – either as a percentage of listings or in units – but the ones they did, were snapped up very quickly. Sometimes different statistics appear to indicate different trends on a short-term basis; such anomalies are almost always resolved over a longer term.
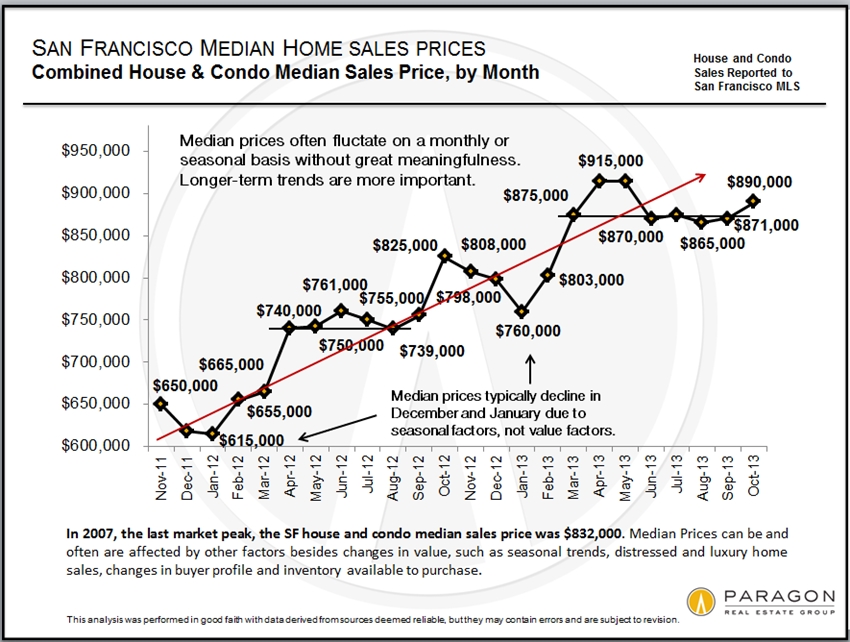
Median Sales Price Appreciation
This chart tracks SF home median price appreciation since the market recovery began in earnest. The overall trend has been dramatically up, but median prices for the last 5 months have been relatively flat after the springtime spike. If the October slowdown in accepted offers had any effect on median prices, it won’t show up until November and December closed sales are tallied. The market has certainly shifted from the frenzy of the first half of the year, but, except for October (affected by default fears), statistical measures of supply and demand have generally continued to show a strong market by historical measures.If a significant shift is occurring in the market, it will become clearer in the statistics of upcoming months. Note that median price changes are not perfectly correlated to changes in home value, as they can be affected by issues such as seasonality and inventory.
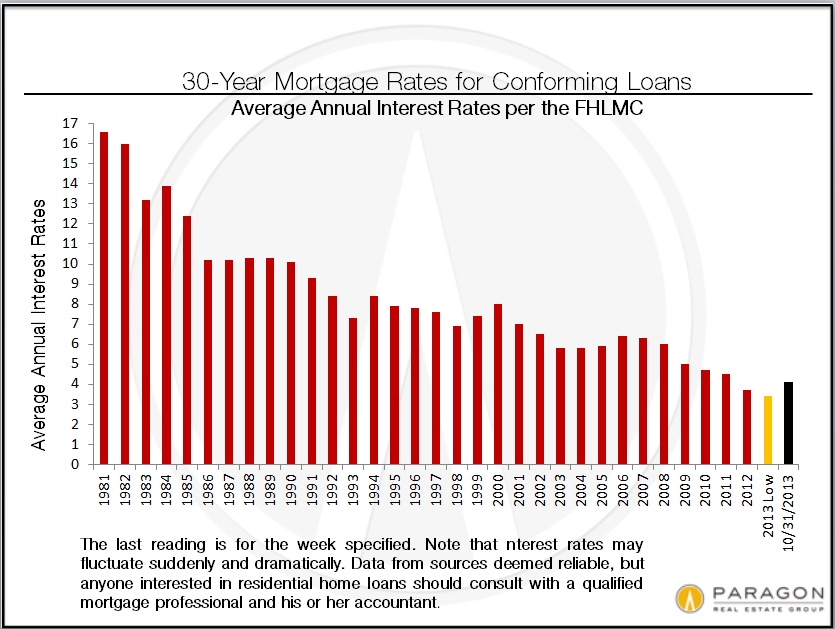
Mortgage Interest Rates
In good news for buyers and sellers, 30-year interest rates have been dropping and are now at their lowest since June (though still above the historic low reached earlier in the year).
Please call or email if you have any questions or comments regarding these analyses.
All data from sources deemed reliable, but may contain errors and is subject to revision. Statistics are generalities and how they apply to any particular property is unknown without a specific comparative market analysis. All numbers should be considered approximate.
© 2013 Paragon Real Estate Group


