April 2025 Market Report

It’s hard to know what to say regarding the staggering volatility and uncertainty that has recently characterized political and economic conditions, much less predict how they will play out over either the short or long term. As of the week ending April 4th, both consumer confidence and financial markets have seen enormous declines. Whether this will continue, or reverse direction is unknown: Policies, actions and reactions have been changing very quickly in 2025.
Uncertainty, much less economic pessimism and plunging household wealth, is not typically a positive factor for housing markets, and increasing affluence from stock gains has played a large role in stimulating local demand since late 2023. Threatened tariffs plus new immigration policies would almost certainly increase home construction costs, but on the plus side, interest rates have begun to decline as investors have fled stocks for bonds. And the current administration maintains that any short-term pain will be far outweighed by positive, long-term economic benefits.
Numbers pertaining to closed-sales data in this report mostly reflect market conditions that predate the most dramatic of recent financial developments. (Because of the typical 3 to 6 week time lapse between deals being made, i.e. listings going into contract, and sales closing escrow, sales data is a lagging indicator of market trends.) The quantifiable, hard-data effects of these new circumstances, should they continue, will come into better focus in coming weeks and months.
Generally speaking, through March 2025, Bay Area markets strengthened as the spring selling season gained steam: Sales volume and overbidding increased, and homes sold more quickly. The quantity of new and active listings rose across the Bay Area – sometimes very substantially – though San Francisco saw among the smallest increases. Luxury home sales out-performed the overall market, as affluent buyers continued to play an outsized role in Q1. Specifics pertaining to the San Francisco market follow within this report.
Report created in good faith using data from sources deemed reliable but may contain errors and subject to revision. Last period figures are preliminary estimates based on data available early in the following month. All numbers approximate, and may change with late-reported activity.
Financial Markets, 2024 – 2025 YTD
Percentage Increases in S&P 500 & Nasdaq since 1/2/24

Data per MarketWatch.com. Data from source deemed reliable but may contain errors and subject to revision. Financial market values change constantly and all numbers to be considered approximate. Financial markets are often prone to significant volatility even on a short-term basis.
VIX Volatility Index*
By Day since September 2022

*CBOE Volatility Index (VIX), per https://www.cboe.com/tradable_products/vix/vix_historical_data/and/or Yahoo! Finance: https://finance.yahoo.com/quote/%5EVIX/history/. Data from sources deemed reliable, but may contain errors. All numbers approximate.
“The CBOE Volatility Index, or VIX, is a real-time market index representing the [stock] market’s expectations for volatility over the coming 30 days. Investors use the VIX to measure the level of risk, fear, or stress in the market when making investment decisions.”
— Investopedia
Mortgage Interest Rates in 2023-2025 YTD
30-Year Conforming Fixed-Rate Loans, Weekly Average Readings*

*Freddie Mac (FHLMC), 30-Year Fixed Rate Mortgage Weekly Average: https://www.freddiemac.com/pmms. Data from sources deemed reliable. Different sources of mortgage data sometimes vary in their determinations of daily and weekly rates. Data from sources deemed reliable but may contain errors. All numbers approximate.
Per Freddie Mac (FHLMC), on April 3, 2025, the weekly average, 30-year, conforming-loan interest rate declined slightly to 6.64%. (The daily average rate – not illustrated on this chart – declined further on 4/3 and 4/4/2025 to its lowest reading since October 2024.)
San Francisco House Price Trends
Median House Sales Prices, 2012 – Present, by Quarter

As reported to NORCAL MLS® ALLIANCE, per Broker Metrics or Infosparks. All numbers are approximate and subject to revision. Last quarter may change with late reported sales.
The Q1 2025 median house sales price ticked up from Q4 2024, but was down almost 2% year over year.
Median sales price is that price where half the homes sold for more and half for less. It is a very general statistic that disguises a wide range of prices in the underlying sales.
Seasonal fluctuations are common, and it’s not unusual for median sales prices to peak for the year in Q2.
San Francisco Condo Price Appreciation
Median Condo Sales Prices, 2012 – Present, by Quarter

As reported to NORCAL MLS® ALLIANCE, per Broker Metrics/Infosparks. All numbers are approximate and subject to revision. Last quarter may change with late reported activity. Does not include new-project condo sales unreported to MLS.
Year over year, the Q1 2025 median condo sales price declined by 9.5%. Q2 often sees a rebound.
Seasonal fluctuations are common. It is not unusual for median sales prices to peak for the calendar year in Q2. Sales prices lag changes in market conditions by 3 to 6 weeks. Different city districts have seen varying median price trends.
San Francisco CONDO Prices: Downtown vs. Non-Downtown
6-Month-Rolling, Median 2-Bedroom Condo Sales Prices since 2005*

*6-month rolling median condo sales values reported to NorCal MLS Alliance, per Infosparks. Analysis may contain errors and subject to revision. Does not include new-project sales unreported to MLS. All numbers approximate, and may change with late-reported sales.
Comparing median 2-bedroom condo sales prices in the greater Downtown/South of Market/Civic Center area (the center of large-project, new-condo construction, office buildings and high-tech employment) – the white line – with the rest of San Francisco (mostly smaller, older buildings, in less urban environments) – the green line.
Median sales prices also vary widely within these two broad regions.
Among ups and downs, the 6-month-rolling, median 2-bedroom condo sales price in the city has typically run in the $1,200,000 to $1,250,000 range since early 2023.
San Francisco CONDO vs. TIC Prices
6-Month-Rolling, Median 2-Bedroom Sales Prices since 2005*

*6-month rolling median sales values reported to NorCal MLS Alliance, per Infosparks. Analysis may contain errors and subject to revision. Does not include new-project sales unreported to MLS. All numbers approximate, and may change with late-reported sales.
Because of the relatively low number of sales, TICs see more fluctuation in median sales price than condos, but generally speaking, over the longer term, 2-BR TICs sold for a median sales price approximately 15% to 20% below 2-BR condos.
San Francisco Home Sales Breakdown
Number of Sales by Property Type & Bedroom Count*
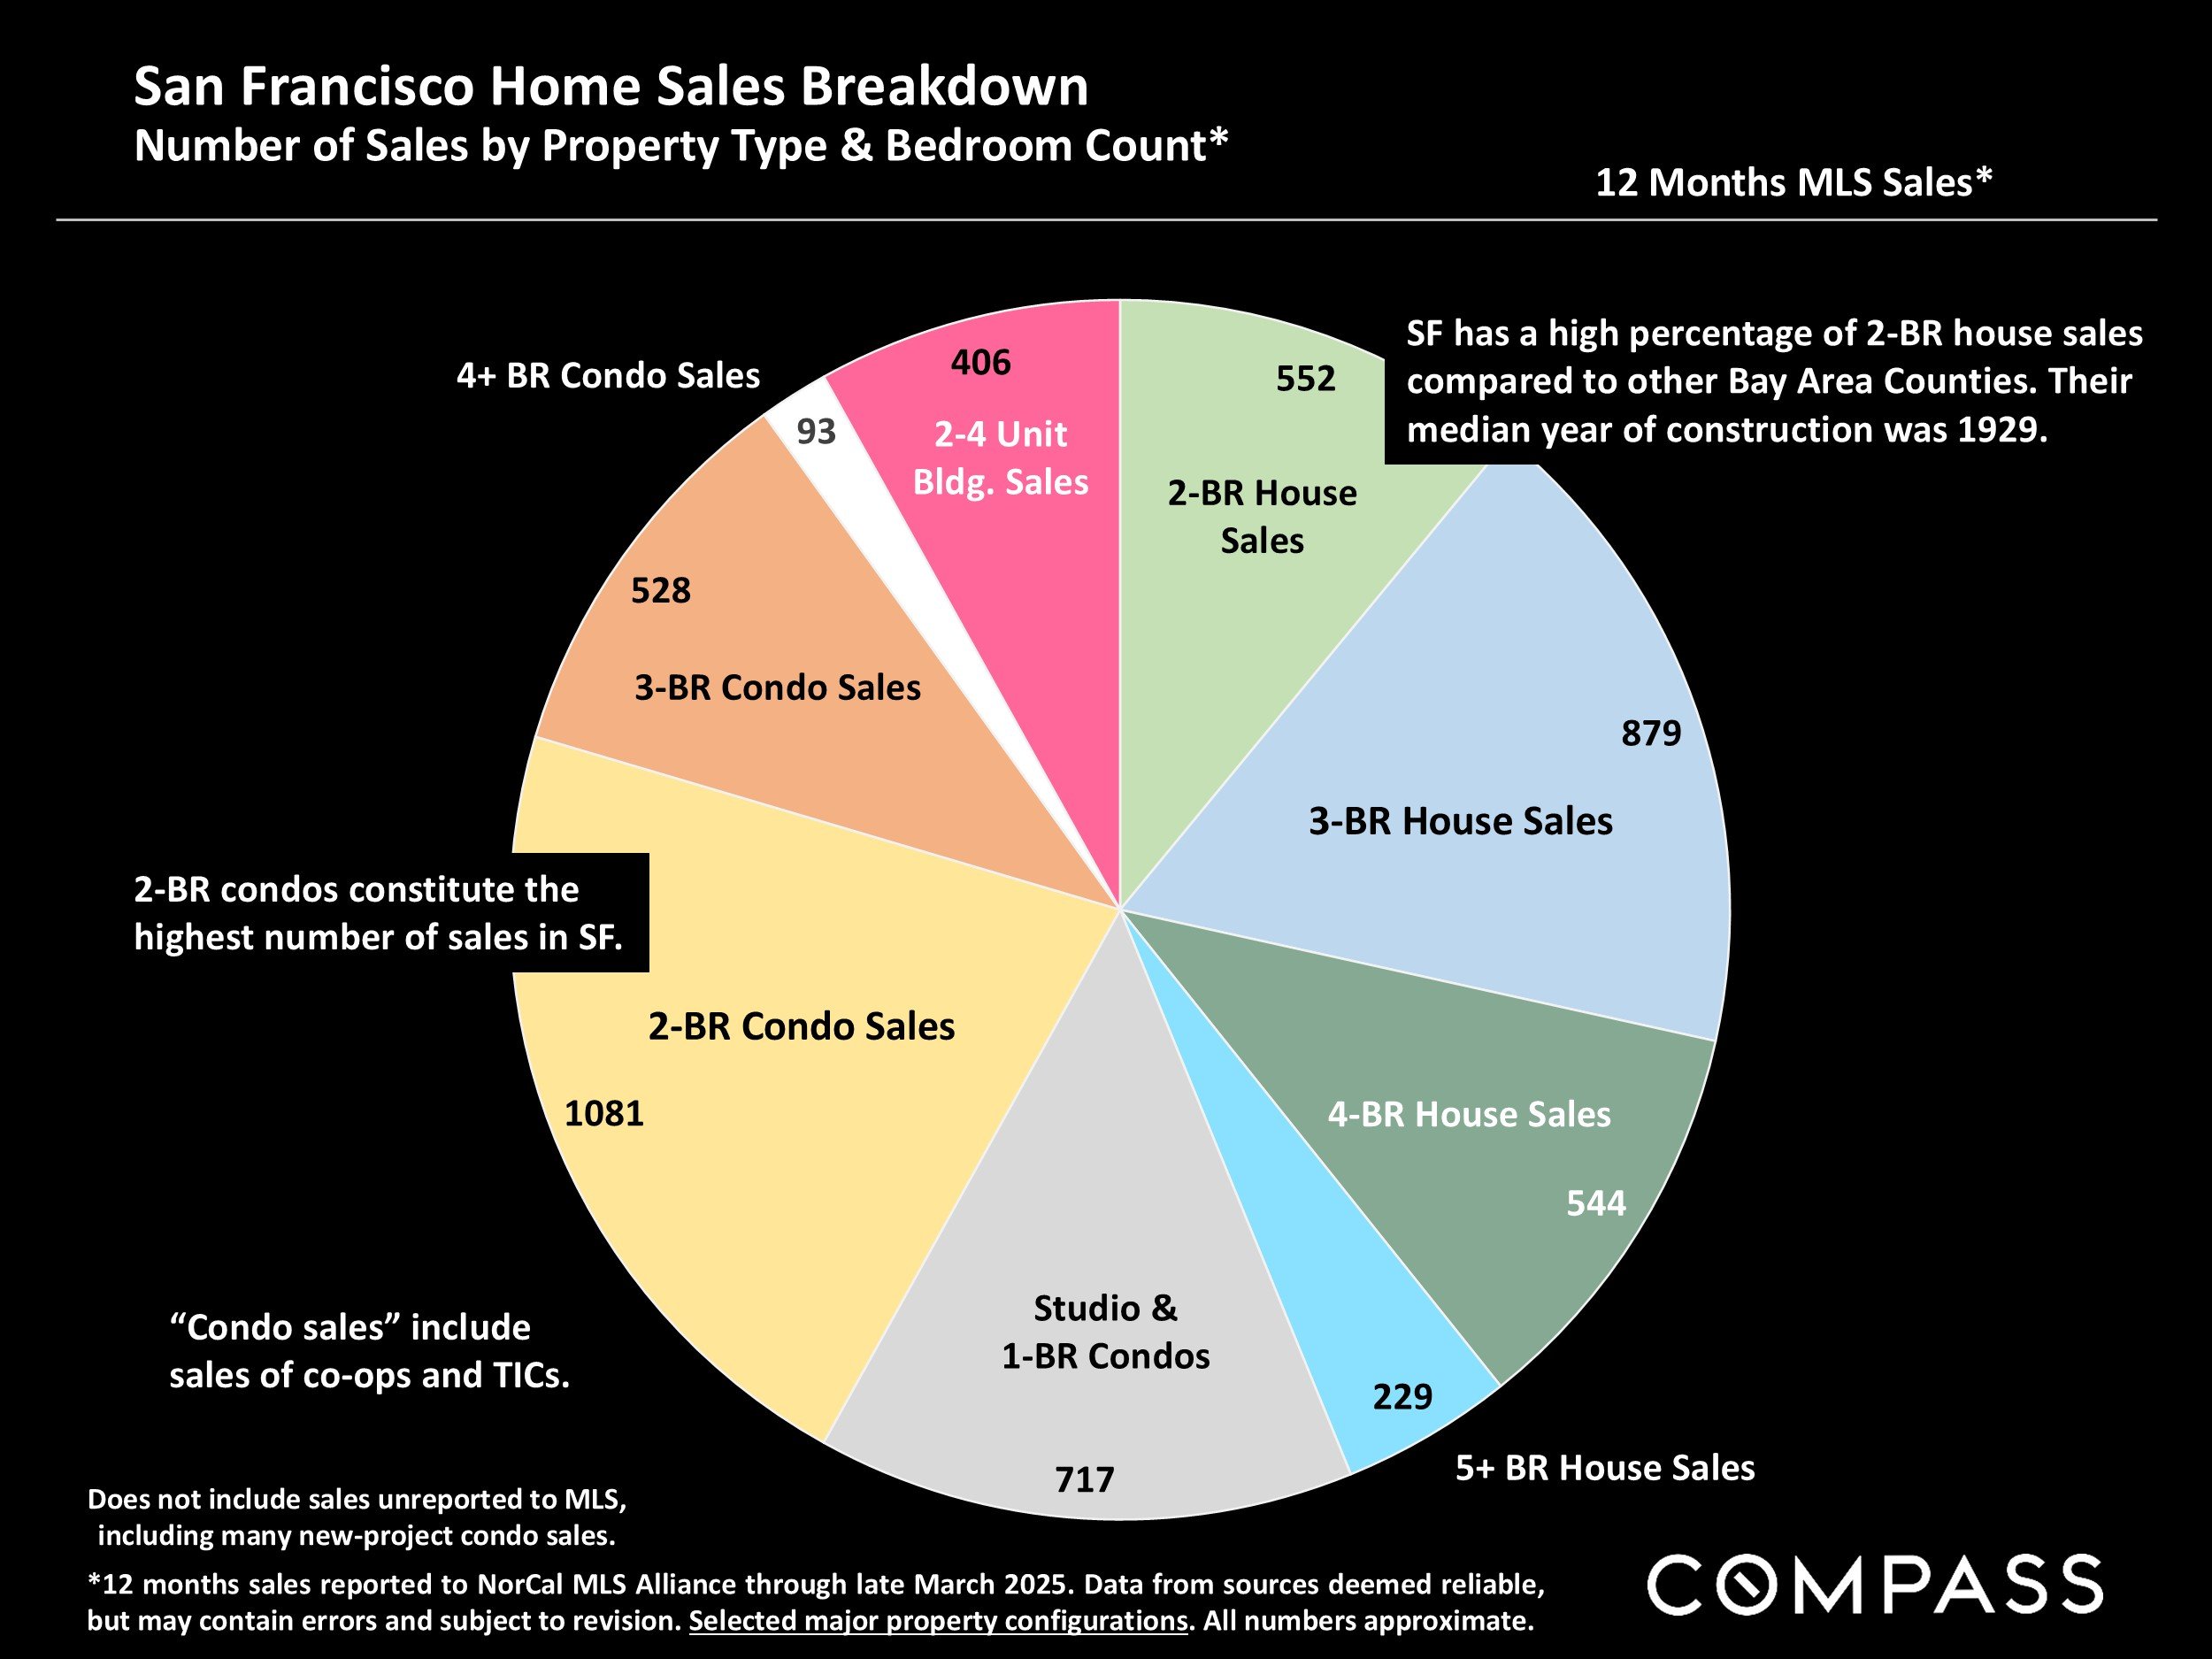
*12 months sales reported to NorCal MLS Alliance through late March 2025. Data from sources deemed reliable, but may contain errors and subject to revision. Selected major property configurations. All numbers approximate. Does not include sales unreported to MLS, including many new-project condo sales.
SF has a high percentage of 2-BR house sales compared to other Bay Area Counties. Their median year of construction was 1929.
2-BR condos constitute the highest number of sales in SF. “Condo sales” include sales of co-ops and TICs.
Bay Area Median House Values by County
2024-2025 Sales By Bedroom/Bath Count*
| 2 BR, 1-2 BA Houses | 3 BR, 2-3 BA Houses, | 3000+ sq.ft. | |||||
|---|---|---|---|---|---|---|---|
| County | Median Sales Price | Median Sq.Ft. | Median $/Sq.St. | Median Sales Price | Median Sq.Ft. | Median $/Sq.St. | |
| Alameda County | $799,000 | 1070 sq.ft. | $750/sq.ft. | $1,250,000 | 1492 sq.ft. | $811/sq.ft. | |
| Contra Costa | $610,000 | 1016 sq.ft. | $577/sq.ft. | $761,500 | 1542 sq.ft. | $518/sq.ft. | |
| Marin County | $1,215,000 | 1135 sq.ft. | $1016/sq.ft. | $1,475,000 | 1712 sq.ft. | $858/sq.ft. | |
| Monterey County | $775,000 | 1046 sq.ft. | $742/sq.ft. | $875,000 | 1604 sq.ft. | $561/sq.ft. | |
| Napa County | $785,000 | 1100 sq.ft. | $764/sq.ft. | $880,000 | 1594 sq.ft. | $595/sq.ft. | |
| San Francisco | $1,280,000 | 1200 sq.ft. | $1039/sq.ft. | $1,606,000 | 1656 sq.ft. | $977/sq.ft. | |
| San Mateo County | $1,309,500 | 1090 sq.ft. | $1241/sq.ft. | $1,850,000 | 1580 sq.ft. | $1178/sq.ft. | |
| Santa Clara County | $1,300,000 | 1046 sq.ft. | $1210/sq.ft. | $1,720,000 | 1443 sq.ft. | $1192/sq.ft. | |
| Santa Cruz County | $850,000 | 1063 sq.ft. | $802/sq.ft. | $1,313,000 | 1669 sq.ft. | $783/sq.ft. | |
| Solano County | $450,000 | 1231 sq.ft. | $357/sq.ft. | $568,000 | 1540 sq.ft. | $376/sq.ft. | |
| Sonoma County | $685,000 | 1200 sq.ft. | $577/sq.ft. | $805,000 | 1626 sq.ft. | $513/sq.ft. |
Bay Area Median House Values by County
2024-2025 Sales By Bedroom/Bath Count*
| 4 BR, 3 BA Houses | 5+ BR, 4+ BA Houses, | 3000+ sq.ft. | |||||
|---|---|---|---|---|---|---|---|
| County | Median Sales Price | Median Square Footage | Median $/Sq.St. | Median Sales Price | Median Sq.Ft./ Median Lot Size |
Median $/Sq.St. | |
| Alameda County | $799,000 | 1070 sq.ft. | $750/sq.ft. | $1,250,000 | 1492 sq.ft. | $811/sq.ft. | |
| Contra Costa | $610,000 | 1016 sq.ft. | $577/sq.ft. | $761,500 | 1542 sq.ft. | $518/sq.ft. | |
| Marin County | $1,215,000 | 1135 sq.ft. | $1016/sq.ft. | $1,475,000 | 1712 sq.ft. | $858/sq.ft. | |
| Monterey County | $775,000 | 1046 sq.ft. | $742/sq.ft. | $875,000 | 1604 sq.ft. | $561/sq.ft. | |
| Napa County | $785,000 | 1100 sq.ft. | $764/sq.ft. | $880,000 | 1594 sq.ft. | $595/sq.ft. | |
| San Francisco | $1,280,000 | 1200 sq.ft. | $1039/sq.ft. | $1,606,000 | 1656 sq.ft. | $977/sq.ft. | |
| San Mateo County | $1,309,500 | 1090 sq.ft. | $1241/sq.ft. | $1,850,000 | 1580 sq.ft. | $1178/sq.ft. | |
| Santa Clara County | $1,300,000 | 1046 sq.ft. | $1210/sq.ft. | $1,720,000 | 1443 sq.ft. | $1192/sq.ft. | |
| Santa Cruz County | $850,000 | 1063 sq.ft. | $802/sq.ft. | $1,313,000 | 1669 sq.ft. | $783/sq.ft. | |
| Solano County | $450,000 | 1231 sq.ft. | $357/sq.ft. | $568,000 | 1540 sq.ft. | $376/sq.ft. | |
| Sonoma County | $685,000 | 1200 sq.ft. | $577/sq.ft. | $805,000 | 1626 sq.ft. | $513/sq.ft. |
Bay Area Median Condo & Townhouse Values
2024-2025 Sales By Property Type & Bedroom/Bath Count*
| 2 BR, 2 BA Condos | 3 BR, 2-3 BA Condos | 3000+ sq.ft. | |||||
|---|---|---|---|---|---|---|---|
| County | Median Sales Price | Median Sq.Ft. | Median $/Sq.St. | Median Sales Price | Median Sq.Ft. | Median $/Sq.St. | |
| Alameda County | $640,000 | 1070 sq.ft. | $591/sq.ft. | $975,000 | 1536 sq.ft. | ||
| Contra Costa | $585,000 | 1127 sq.ft. | $524/sq.ft. | $788,500 | 1540 sq.ft. | ||
| Marin County | $685,000 | 1156 sq.ft. | $609/sq.ft. | $875,000 | 1612 sq.ft. | ||
| Monterey County | $795,000 | 1151 sq.ft. | $633/sq.ft. | $697,500 | 1536 sq.ft. | ||
| Napa County | $755,000 | 1195 sq.ft. | $540/sq.ft. | Too few sales | |||
| San Francisco | $1,249,000 | 1181 sq.ft. | $1034/sq.ft. | Too few sales | |||
| San Mateo County | $885,000 | 1165 sq.ft. | $753/sq.ft. | $1,473,000 | 1600 sq.ft. | ||
| Santa Clara County | $808,000 | 1133 sq.ft. | $726/sq.ft. | $1,350,000 | 1564 sq.ft. | ||
| Santa Cruz County | $836,000 | 1108 sq.ft. | $724/sq.ft. | $975,000 | 1514 sq.ft. | ||
| Solano County | $390,000 | 1014 sq.ft. | $356/sq.ft. | Too few sales | |||
| Sonoma County | $430,000 | 1038 sq.ft. | $408/sq.ft. | $551,500 | 1367 sq.ft. |
*Sales reported to NorCal MLS Alliance in the 12 months to mid-late March 2025. Counties contain submarkets of widely varying values. Median values fluctuate for reasons besides changes in fair market value. Data from sources deemed reliable, but may contain errors and subject to revision. Numbers approximate, and data constantly changes as new sales occur. Not all sales are reported to MLS.
How these values apply to any particular home is unknown without a specific comparative market analysis.
San Francisco Population Trends since 2010
U.S. Census Estimates, July 1st to July 1st

Estimates as of July 1 of each year. 2020-2024 data published March 13, 2025 by U.S. Census. The Census often revises numbers in subsequent estimates. All numbers to be considered approximate.
2023 to 2024, the county saw negative domestic migration, positive foreign migration, and more births than deaths – to total a 1% increase.
Population changes are driven by domestic and foreign migration into and out of the county, and by natural causes (births less deaths).
Data pertaining to changes in rent rates, rental vacancy rates, and median household income indicates that the greatest loss of residents 2020-2021 was of tenants.
San Francisco: Components of Population Change*

*Estimates published 3/13/25 by U.S. Census. All numbers approximate, may contain errors, and may be revised in future estimates. Census numbers may not total perfectly due to “Population change that cannot be attributed to any specific demographic component.”
SF population changes in recent years have been characterized by 1) many more residents moving out to other U.S. locations than moving in from within the U.S., 2) many more people immigrating in from foreign countries than residents moving abroad, and 3) more births than deaths. Total population has declined since the pandemic hit, but began to rebound during the last 12-month period measured. It is expected than net foreign migration numbers will plummet in 2025 due to new federal policies.
New Listings Coming on Market
San Francisco Market Dynamics & Seasonality*

*Per Realtor.com Research: https://www.realtor.com/research/data/, listings posted on site. Data from sources deemed reliable, but may contain errors and subject to revision. May not include “coming-soon” listings. All numbers should be considered approximate.
The number of new listings in March 2025 rose from February, and was up 14% year over year.
Active & Coming-Soon Listings on 1st of Month*
San Francisco Homes Market
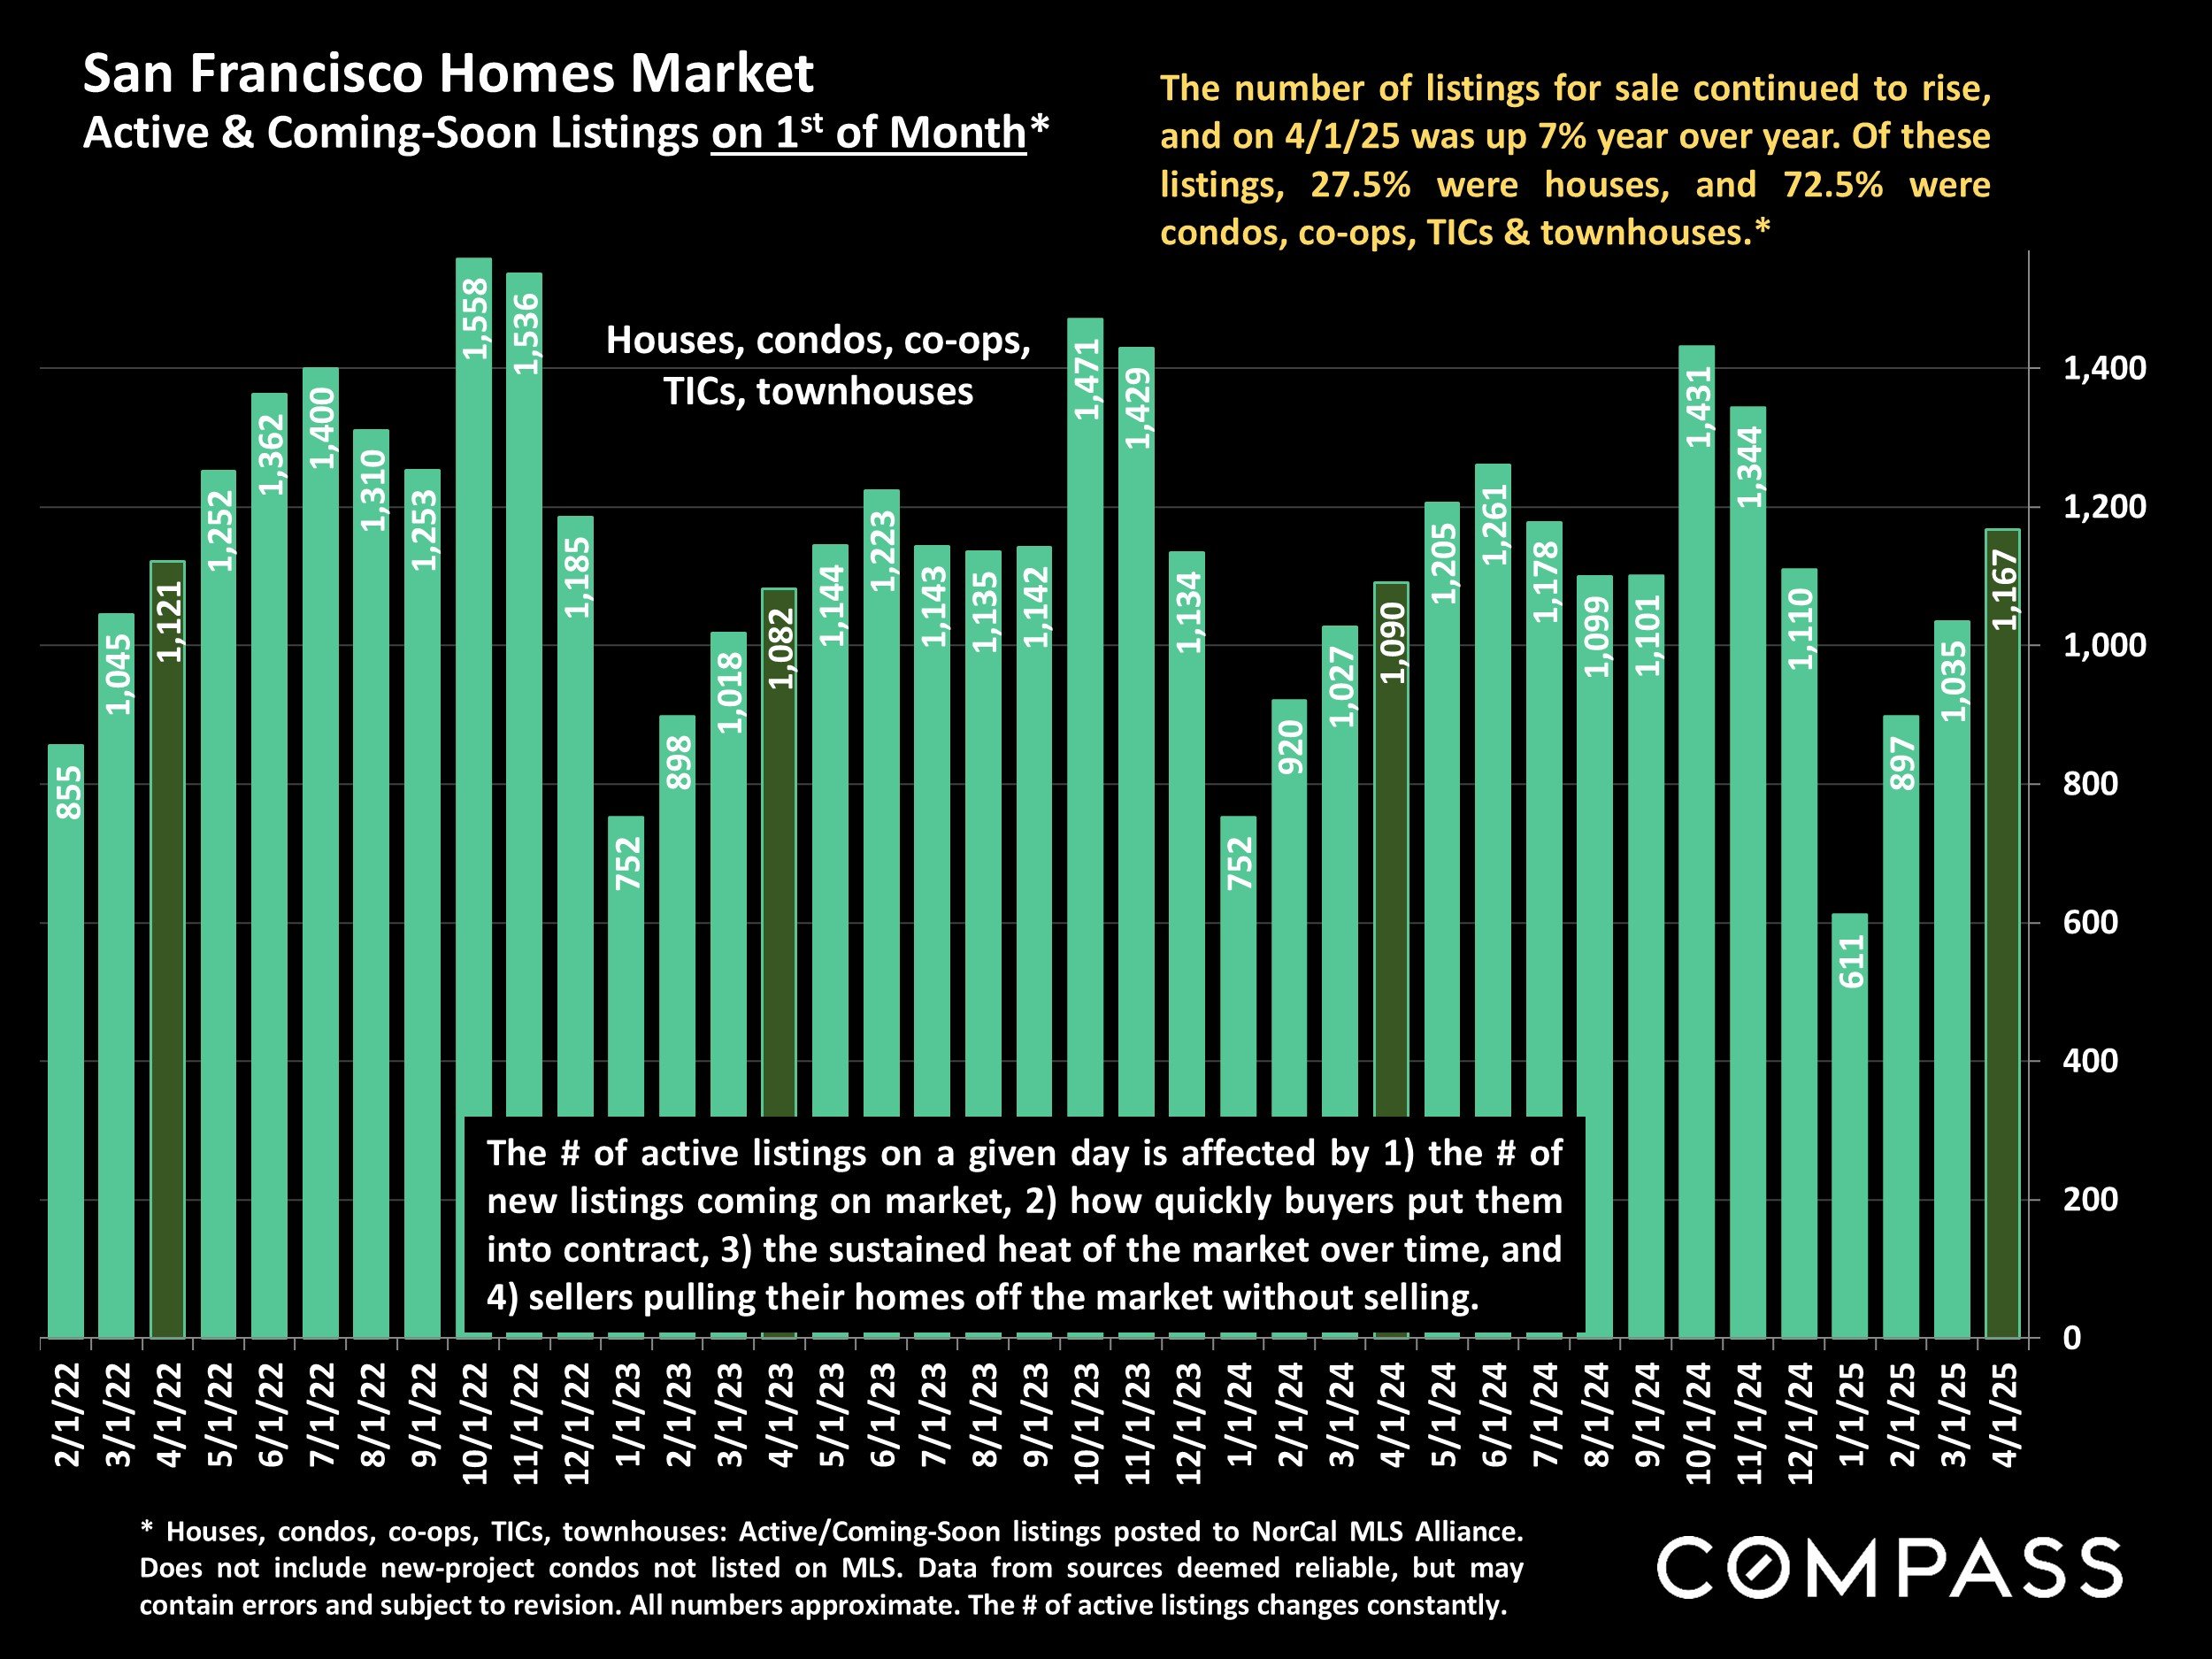
* Houses, condos, co-ops, TICs, townhouses: Active/Coming-Soon listings posted to NorCal MLS Alliance. Does not include new-project condos not listed on MLS. Data from sources deemed reliable, but may contain errors and subject to revision. All numbers approximate. The # of active listings changes constantly.
The number of listings for sale continued to rise, and on 4/1/25 was up 7% year over year. Of these listings, 27.5% were houses, and 72.5% were condos, co-ops, TICs & townhouses.*
The # of active listings on a given day is affected by 1) the # new listings coming on market, 2) how quickly buyers put theminto contract, 3) the sustained heat of the market over time, and 4) sellers pulling their homes off the market without selling.
Listings Accepting Offers (Going into Contract)
San Francisco Market Dynamics & Seasonality

Residential activity reported to MLS, per Broker Metrics. Will not include new-project condo activity not reported to MLS. Data from sources deemed reliable, but may contain errors and subject to revision. All numbers approximate, and may change with late-reported activity.
The number of listings going into contract continued its new-year rebound in March 2025, but it declined about 3% compared to March 2024.
The number of listings going into contract is an indicator of future sales.
Percentage of Listings Accepting Offers
San Francisco Market Dynamics by Quarter

Residential activity reported to SFARMLS, per Broker Metrics. Data from sources deemed reliable, but may contain errors and subject to revision. All numbers are approximate and may change with late-reported activity.
Absorption Rate: The higher the percentage of listings going into contract, the stronger the buyer demand as compared to the supply of listings for sale. The house market (green columns) has had much higher absorption rates than condos.
Monthly Home Sales Volume*
San Francisco Market Dynamics & Seasonality

*Sales of houses, condos, townhouses reported to NorCal MLS Alliance, per Infosparks. Does not include new-project condo sales unreported to MLS. Data from sources deemed reliable but may contain errors and subject to revision. Last month estimated based on available information and may change with late reported sales. All numbers approximate.
Sales volume in March 2025 increased from February and jumped 20% from March 2024.
House sales made up 44.5% of March 2025 sales, and condo, co-op and TICs made up 55.5%.
Sales in one month mostly reflect accepted offers in the previous month, i.e. they are a lagging indicator of market conditions.
Luxury Home Sales, $5 Million+*
San Francisco Market Dynamics & Seasonality

*Sales of houses, condos, co-ops, townhouses reported to NorCal MLS Alliance, per Infosparks. Does not include new-project condo sales unreported to MLS. Data from sources deemed reliable but may contain errors and subject to revision. Last month may change with late reported sales. All numbers approximate.
$5 million home sales in March 2025 jumped from February and increased 100% from March 2024.
The luxury home market is fiercely seasonal: High sales activity in spring, then slowing in summer, rebounding in fall, and plunging in mid-winter.
Sales in one month mostly reflect accepted offers in the previous month.
San Francisco Luxury House Sales*
Houses Selling for $5 Million+ since 2019

*House sales reported to NorCal MLS Alliance, per Infosparks. Does not generally include listings and sales unreported to MLS. Data from sources deemed reliable but may contain errors and subject to revision. All numbers approximate, and may change with late-reported activity.
Luxury house sales surged in March 2025 as the spring selling season got started. It saw the highest March count since the end of the pandemic boom.
The luxury home market is fiercely seasonal: High sales activity in spring, then slowing in summer, rebounding in fall, and plunging in mid-winter.
San Francisco Luxury Condo & Co-op Sales*
Units Selling for $2.5 Million+ since 2018

*Includes sales of condos, co-ops, townhouses, TICs reported to NorCal MLS Alliance, per Infosparks. Does not include sales unreported to MLS, such as some new-project condos. Data from sources deemed reliable but may contain errors and subject to revision. All numbers approximate, and may change with late-reported activity.
Luxury condo and co-op sales bounced in March 2025 were slightly down from February, but higher year over year.
The luxury home market is typically very seasonal in nature: High sales activity in spring, then slowing in summer, rebounding in fall, and dropping in mid-winter.
Price Reductions on Active Listings
San Francisco Market Dynamics & Seasonality

Per Realtor.com Research: https://www.realtor.com/research/data/, listings posted to site. Data from sources deemed reliable, but may contain errors and subject to revision. All numbers approximate.
The number of price reductions typically ebbs and flows by season, but can also be affected by specific events in the economy and the market. The number of price reductions in March 2025 rose 10% year over year.
Overbidding List Prices in San Francisco
Percentage of Home Sales Closing over List Price

Sales data reported to NORCAL MLS® ALLIANCE, per Infosparks. Reflecting the percentage of sales closing at sales prices over the final list prices. Data from sources deemed reliable, but may contain errors and subject to revision. All numbers are approximate, and may change with late-reported sales.
Overbidding is generally caused by buyer competition for new listings. The overall overbidding percentage in the latest month was 60% of sales, but for houses alone, it was 79%, and for condos, 42%.
This statistic fluctuates according to seasonal demand trends, and is a lagging indicator of market activity 3-6 weeks earlier.
Avg. Sales Price to Original List Price Percentage (SP/LP %)
San Francisco Market Dynamics since 2018, by Quarter

Residential market activity reported to NORCAL MLS® ALLIANCE, per Infosparks. Data from sources deemed reliable, but may contain errors and subject to revision. Percentages rounded, all numbers are approximate, and may change with late-reported sales.
100% signifies an average sales price at original list price. Sales Price to List Price percentages for houses remain much higher than that for condos, but this metric can be distorted by underpricing strategies.
Average Days on Market – Speed of Sale
San Francisco Market Dynamics by Quarter

Time to acceptance of offer for sold listings. Activity reported to NORCAL MLS® ALLIANCE, per Infosparks. “Condos” include co-op and TIC sales. Data from sources deemed reliable, but may contain errors and subject to revision. All numbers approximate, and may change with late-reported sales.
Generally speaking, the lower the average days on market to acceptance of offer, the stronger the buyer demand. House listings (white line) typically sell much faster than condos, co-ops & TICs (gold columns).
Housing Affordability by Quarter since 2006

Chart from the California Association of Realtors “2025 CALIFORNIA ECONOMIC & HOUSING MARKET UPDATE” published March 2025. Data from sources deemed reliable, but may contain errors and subject to revision. All numbers should be considered approximate.
The Housing Affordability Index measures the percentage of households that can afford to buy the median priced house (the % would be higher if condos were included.) The major factors are 1) the median house sales price, 2) the prevailing mortgage interest rate, and 3) household income distribution. The higher the percentage, the more affordable the housing.
New Housing Permit Issuance Continues to Run Extremely Low

Chart from the California Association of Realtors “2025 CALIFORNIA ECONOMIC & HOUSING MARKET UPDATE” published March 2025. Data from sources deemed reliable, but may contain errors and subject to revision. All numbers should be considered approximate estimates.
Percentage of Households Owning Their Homes

Chart from the California Association of Realtors “2025 CALIFORNIA ECONOMIC & HOUSING MARKET UPDATE” published March 2025. Data from sources deemed reliable, but may contain errors and subject to revision. All numbers should be considered approximate estimates.
San Francisco has the lowest homeownership rate in the Bay Area, though it has increased since the pandemic hit (when population loss was mostly driven by tenants leaving the city).
It is not unusual for large urban areas to have majority tenant populations.
Statistics are generalities, essentially summaries of widely disparate data generated by dozens, hundreds or thousands of unique, individual sales occurring within different time periods. They are best seen not as precise measurements, but as broad, comparative indicators, with reasonable margins of error. Anomalous fluctuations in statistics are not uncommon, especially in smaller, expensive market segments. Last period data should be considered estimates that may change with late-reported data. Different analytics programs sometimes define statistics – such as “active listings,” “days on market,” and “months supply of inventory” – differently: what is most meaningful are not specific calculations but the trends they illustrate. Most listing and sales data derives from the local or regional multi-listing service (MLS) of the area specified in the analysis, but not all listings or sales are reported to MLS and these won’t be reflected in the data. “Homes” signifies real-property, single-household housing units: houses, condos, co-ops, townhouses, duets and TICs (but not mobile homes), as applicable to each market. City/town names refer specifically to the named cities and towns, unless otherwise delineated. Multi-county metro areas will be specified as such. Data from sources deemed reliable, but may contain errors and subject to revision. All numbers to be considered approximate.
Many aspects of value cannot be adequately reflected in median and average statistics: curb appeal, age, condition, amenities, views, lot size, quality of outdoor space, “bonus” rooms, additional parking, quality of location within the neighborhood, and so on. How any of these statistics apply to any particular home is unknown without a specific comparative market analysis.
Median Sales Price is that price at which half the properties sold for more and half for less. It may be affected by seasonality, “unusual” events, or changes in inventory and buying trends, as well as by changes in fair market value. The median sales price for an area will often conceal an enormous variety of sales prices in the underlying individual sales.
Dollar per Square Foot is based upon the home’s interior living space and does not include garages, unfinished attics and basements, rooms built without permit, patios, decks or yards (though all those can add value to a home). These figures are usually derived from appraisals or tax records, but are sometimes unreliable (especially for older homes) or unreported altogether. The calculation can only be made on those home sales that reported square footage.
Compass is a real estate broker licensed by the State of California, DRE 01527235. Equal Housing Opportunity. This report has been prepared solely for information purposes. The information herein is based on or derived from information generally available to the public and/or from sources believed to be reliable. No representation or warranty can be given with respect to the accuracy or completeness of the information. Compass disclaims any and all liability relating to this report, including without limitation any express or implied representations or warranties for statements contained in, and omissions from, the report. Nothing contained herein is intended to be or should be read as any regulatory, legal, tax, accounting or other advice and Compass does not provide such advice. All opinions are subject to change without notice. Compass makes no representation regarding the accuracy of any statements regarding any references to the laws, statutes or regulations of any state are those of the author(s). Past performance is no guarantee of future results.