February 2025 Market Report

Photo by Rvs1966 on Flickr via Creative Commons license.
The Fed kept its benchmark rate unchanged; interest rates ticked down below 7%; stock markets remain high (though sometimes volatile); consumer confidence turned a bit unsure about the future. A terrible climate-related disaster rocked the state, with human and financial costs and consequences that will take years to quantify. And for better or worse – you can make your own evaluation – national and international politics have been thoroughly destabilized by new and constantly changing developments, with yet uncertain effects on society, the economy and housing markets.
But in local real estate, 2025 began with the usual new year rebound: The numbers of new listings and of listings going into contract have bounced back from their annual low counts in December, and both are almost certain to rise rapidly as we move further into the year. In the Bay Area, we are already on the cusp of spring, which typically sees the most heated market conditions of the year, and, not unusually, the highest median home sales prices.
“Our outlook for the U.S. economy is positive and offers a promising perspective on the housing market in the year ahead. We expect the U.S. labor market to continue to cool in 2025, which will reduce some of the pressures on inflation. And though we forecast mortgage rates to remain higher for longer, we expect the rate lock-in effect to cool off throughout the year as homeowners adjust to the new normal with respect to rates, therefore adding more inventory to the market.” Freddie Mac Research, 1/28/25
30-Year, Fixed-Rate, JUMBO Mortgage Index*
Optimal Blue Mortgage Market Index since 2018

* Optimal Blue, 30-Year Fixed Rate Jumbo Mortgage Index, on a given day. Retrieved from FRED, Federal Reserve Bank of St. Louis; https://fred.stlouisfed.org/series/OBMMIJUMBO30YF. Data from sources deemed reliable, but may contain errors and subject to revision. All numbers should be considered approximate.
In 2025, single-family loans with balances above $806,500 in most counties, and $1,209,750 in high-cost areas, are considered jumbo.
San Francisco HOUSE Price Trends since 1990
Monthly Median House Sales Prices, 3-Month Rolling

3-month rolling average of monthly median sales prices for “existing” houses, per CA Association of Realtors or 3-month rolling median per NorCal MLS Alliance. Analysis may contain errors and subject to revision. All numbers approximate, and may change with late-reported sales.
The 3-month-rolling median house sales price in January 2025 was unchanged year-over-year. It will usually climb quickly to hit its annual peak in spring.
Median sales price is that price at which half the sales occurred for more and half for less. It is a very general statistic, disguising an enormous range of sales prices in the underlying sales. It is often affected by other factors besides changes in fair market value. Monthly and seasonal fluctuations are common, which explain many of the regular ups and downs in this chart. More often than not, median sales prices peak for the year in spring.
Annual Median House Sales Prices
by Bay Area County + Sacramento, 2011 – 2024*

*Sales reported to MLS, per the CA Association of Realtors, or NorCal MLS Alliance, per Infosparks. Data from sources deemed reliable but may contain errors and subject to revision. All numbers approximate. Different data sources sometimes calculate median house sales prices using varying methodologies.
Due to specific market conditions and economic/ demographic factors, appreciation rates between counties vary year-to-year – sometimes significantly – but over the longer term, home prices throughout the region (and country) tend to move in parallel directions up or down, affected by the same major macroeconomic factors.
Median sales price is that price at which half the sales occurred for more and half for less. It can be affected by factors besides changes in fair market value.
San Francisco CONDO Price Trends since 2005
Median Condo Sales Price, 3-Month Rolling

3-month rolling median condo sales prices reported to NorCal MLS Alliance, per Infosparks. Analysis may contain errors and subject to revision. All numbers approximate, and may change with late-reported sales.
Generally speaking, over the last 5-6 years, Bay Area median condo sales prices have not seen the appreciation rates common in house markets.
Median sales price is that price at which half the sales occurred for more and half for less. It is a very general statistic, often affected by other factors besides changes in fair market value. Monthly and seasonal fluctuations are common, and longer-term trends are more meaningful than short-term changes.
The 3-month-rolling median condo sales price in January 2025 was about 2% down year-over-year. The price often hits its annual low in mid-winter.
San Francisco CONDO Prices: Downtown vs. Non-Downtown
6-Month-Rolling, Median 2-Bedroom Condo Sales Prices since 2005*

*6-month rolling median condo sales values reported to NorCal MLS Alliance, per Infosparks. Analysis may contain errors and subject to revision. Does not include new-project sales unreported to MLS. All numbers approximate, and may change with late-reported sales.
Comparing median 2-bedroom condo sales prices in the greater Downtown/South of Market/Civic Center area (the center of large-project, new-condo construction, office buildings and high-tech employment) – the white line – with the rest of San Francisco (mostly smaller, older buildings, in less urban environments) – the green line. Median sales prices also vary widely within these two broad regions.
Year over year, the January 2025, 6-month-rolling median 2-BR condo price in the greater downtown/SoMa area was unchanged, but up approximately 4% in the rest of the city.
2024 Median 2-Bedroom Condo Sales Prices
Greater Bay Area + Sacramento, by County*

*Sales reported to NorCal MLS Alliance by late January 2025, per Infosparks. Data from sources deemed reliable, but all numbers are approximate, may contain errors and subject to revision. Doesn’t include new-project condo sales unreported to MLS. Late-reported sales may change prices.
San Francisco has by far the largest luxury condo market, which is a major factor in its much higher median sales price. SF is also the only county where sales of condos and condo-like units outnumber house sales.
Median sales price is that price at which half the sales occurred for more and half for less. In some counties, condo construction has been concentrated in specific submarkets, whose values, high or low, will affect county median sales prices.
San Francisco Value Trends since 2005
3-Month-Rolling, Median Dollar per Square Foot Values*

*3-month rolling median house sales values reported to NorCal MLS Alliance, per Infosparks. Analysis may contain errors and subject to revision. All numbers approximate, and may change with late-reported sales.
Until the pandemic, the median $/sq.ft. value for condos (green columns) ran substantially higher than for houses (white line), but that is no longer the case.
Median $/sq.ft. value is a general statistic, disguising an enormous range of values in the underlying sales. It is often affected by other factors besides changes in fair market value. Monthly and seasonal fluctuations are common, which explain many of the regular ups and downs in this chart.
2024 Median House Dollar per Square Foot Values
Greater Bay Area + Sacramento, by County*

*Sales reported to NorCal MLS Alliance by late January 2025, per Infosparks. Late-reported sales may change calculations. Data from sources deemed reliable, but all numbers are approximate, may contain errors and subject to revision.
Dollar per Square Foot is based upon interior living space and doesn’t include garages, attics, basements, rooms built without permit, decks, patios or lot size (though all those can add value). All things being equal, a smaller home will typically sell for a higher dollar per square foot value.
New Listings Coming on Market
San Francisco Market Dynamics & Seasonality

Per Realtor.com Research: https://www.realtor.com/research/data/, listings posted on site. Data from sources deemed reliable, but may contain errors and subject to revision. May not include “coming-soon” listings. All numbers should be considered approximate.
After hitting its nadir in December, new-listing activity usually climbs rapidly through spring. January 2025 began with a large rebound, which will help fuel the February market.
Active & Coming-Soon Listings on 1st of Month*
San Francisco Homes Market

* Houses, condos, co-ops, TICs, townhouses: Active/Coming-Soon listings posted to NorCal MLS Alliance. Does not include new-project condos not listed on MLS. Data from sources deemed reliable, but may contain errors and subject to revision. All numbers approximate. The # of active listings changes constantly.
The number of listings for sale has begun to rise, but on 2/1/25 was slightly down year over year. Of these listings, 27% were houses, and 73% were condos, co-ops, TICs & townhouses.*
The # of active listings on a given day is affected by 1) the # of new listings coming on market, 2) how quickly buyers put them into contract, 3) the sustained heat of the market over time, and 4) sellers pulling their homes off the market without selling.
Listings Accepting Offers (Going into Contract)
San Francisco Market Dynamics & Seasonality

Residential activity reported to MLS, per Broker Metrics. Data from sources deemed reliable, but may contain errors and subject to revision. All numbers approximate, and may change with late-reported activity.
The number of listings going into contract began its new-year rebound in mid-January. It was higher year-over-year, and can be expected to surge in coming months as the market moves into the spring selling season.
Percentage of Listings Accepting Offers
San Francisco: Absorption Rate by Month

*SFARMLS reported data, per Broker Metrics. Not all new-condo project activity is reported to MLS. Last month’s data estimated using available data, may change with late reported activity. Data from sources deemed reliable but may contain errors and subject to revision. All numbers approximate.
The absorption rate in January 2025 jumped very dramatically over the usual annual low in December. For houses alone, the rate was about 35%, and for condos, 22%, reflecting their respective supply and demand dynamics.
Absorption rate measures buyer demand vs. the supply of listings for sale: The higher the percentage, the more heated and competitive the market.
Monthly Home Sales Volume*
San Francisco Market Dynamics & Seasonality

*Sales of houses, condos, townhouses reported to NorCal MLS Alliance, per Infosparks. Does not include new-project condo sales unreported to MLS. Data from sources deemed reliable but may contain errors and subject to revision. Last month estimated based on available information and may change with late reported sales. All numbers approximate.
Sales in one month mostly reflect accepted offers in the previous month: January’s annual low count generally reflects the big December slowdown in market activity. Year over year, January 2025 sales rose about 25%.
The number of sales will almost certainly increase quickly in coming months.
San Francisco Luxury House Sales*
Houses Selling for $5 Million+ since 2018

*House sales reported to NorCal MLS Alliance, per Infosparks. Does not generally include listings and sales unreported to MLS. Data from sources deemed reliable but may contain errors and subject to revision. All numbers approximate, and may change with late-reported activity.
The luxury home market is usually fiercely seasonal: High sales activity in spring, then slowing in summer, rebounding in fall, and plunging in mid-winter. January 2025 saw a jump in luxury home sales over the very low count in December.
San Francisco Luxury Condo & Co-op Sales*
Units Selling for $2.5 Million+ since 2018

*Includes sales of condos, co-ops, townhouses, TICs reported to NorCal MLS Alliance, per Infosparks. Does not include sales unreported to MLS, such as some new-project condos. Data from sources deemed reliable but may contain errors and subject to revision. All numbers approximate, and may change with late-reported activity.
The luxury home market is usually very seasonal in nature: High sales activity in spring, then slowing in summer, rebounding in fall, and dropping in mid-winter.
Luxury condo and co-op sales bounced back in January 2025 from December’s low count, and were up 40% year over year. It is very likely that sales will continue to increase moving into spring.
Price Reductions on Active Listings
San Francisco Market Dynamics & Seasonality

Per Realtor.com Research: https://www.realtor.com/research/data/, listings posted to site. Data from sources deemed reliable, but may contain errors and subject to revision. All numbers approximate.
The number of price reductions in October 2024 climbed to its highest count of the year, but, as usual, has dropped back down as the market slowed in mid-winter.
The number of price reductions typically ebbs and flows by season, but can also be affected by specific events in the economy and the market.
Average Days on Market – Speed of Sale
San Francisco Market Dynamics & Seasonality

Sales reported to NorCal MLS Alliance, per Infosparks. Data derived from sources deemed reliable, but may contain errors and subject to revision. All numbers approximate, and may change with late-reported sales.
Houses (green line) typically sell much faster than condos (blue line). Homes usually sell fastest in spring and early autumn, and slowest in mid-winter.
Measuring how long it takes for sold listings to accept offers. Sales in 1 month mostly reflects accepted offers in the previous month. Monthly fluctuations are not uncommon.
Overbidding List Prices in San Francisco
Percentage of Home Sales Closing over List Price

Sales data reported to NORCAL MLS® ALLIANCE, per Infosparks. Reflecting the percentage of sales closing at sales prices over the final list prices. Data from sources deemed reliable, but may contain errors and subject to revision. All numbers are approximate, and may change with late-reported sales.
Overbidding is generally caused by buyer competition for new listings. The overall percentage in the latest month was 38%, but for houses alone, it was 59%, and for condos, 19%. Overbidding can be expected to jump as the market heats up in coming months.
This statistic fluctuates according to seasonal demand trends, and is a lagging indicator of market activity 3-6 weeks earlier.
Average Sales Price to Original List Price Percentage
San Francisco Over/Under Bidding: Market Dynamics & Seasonality
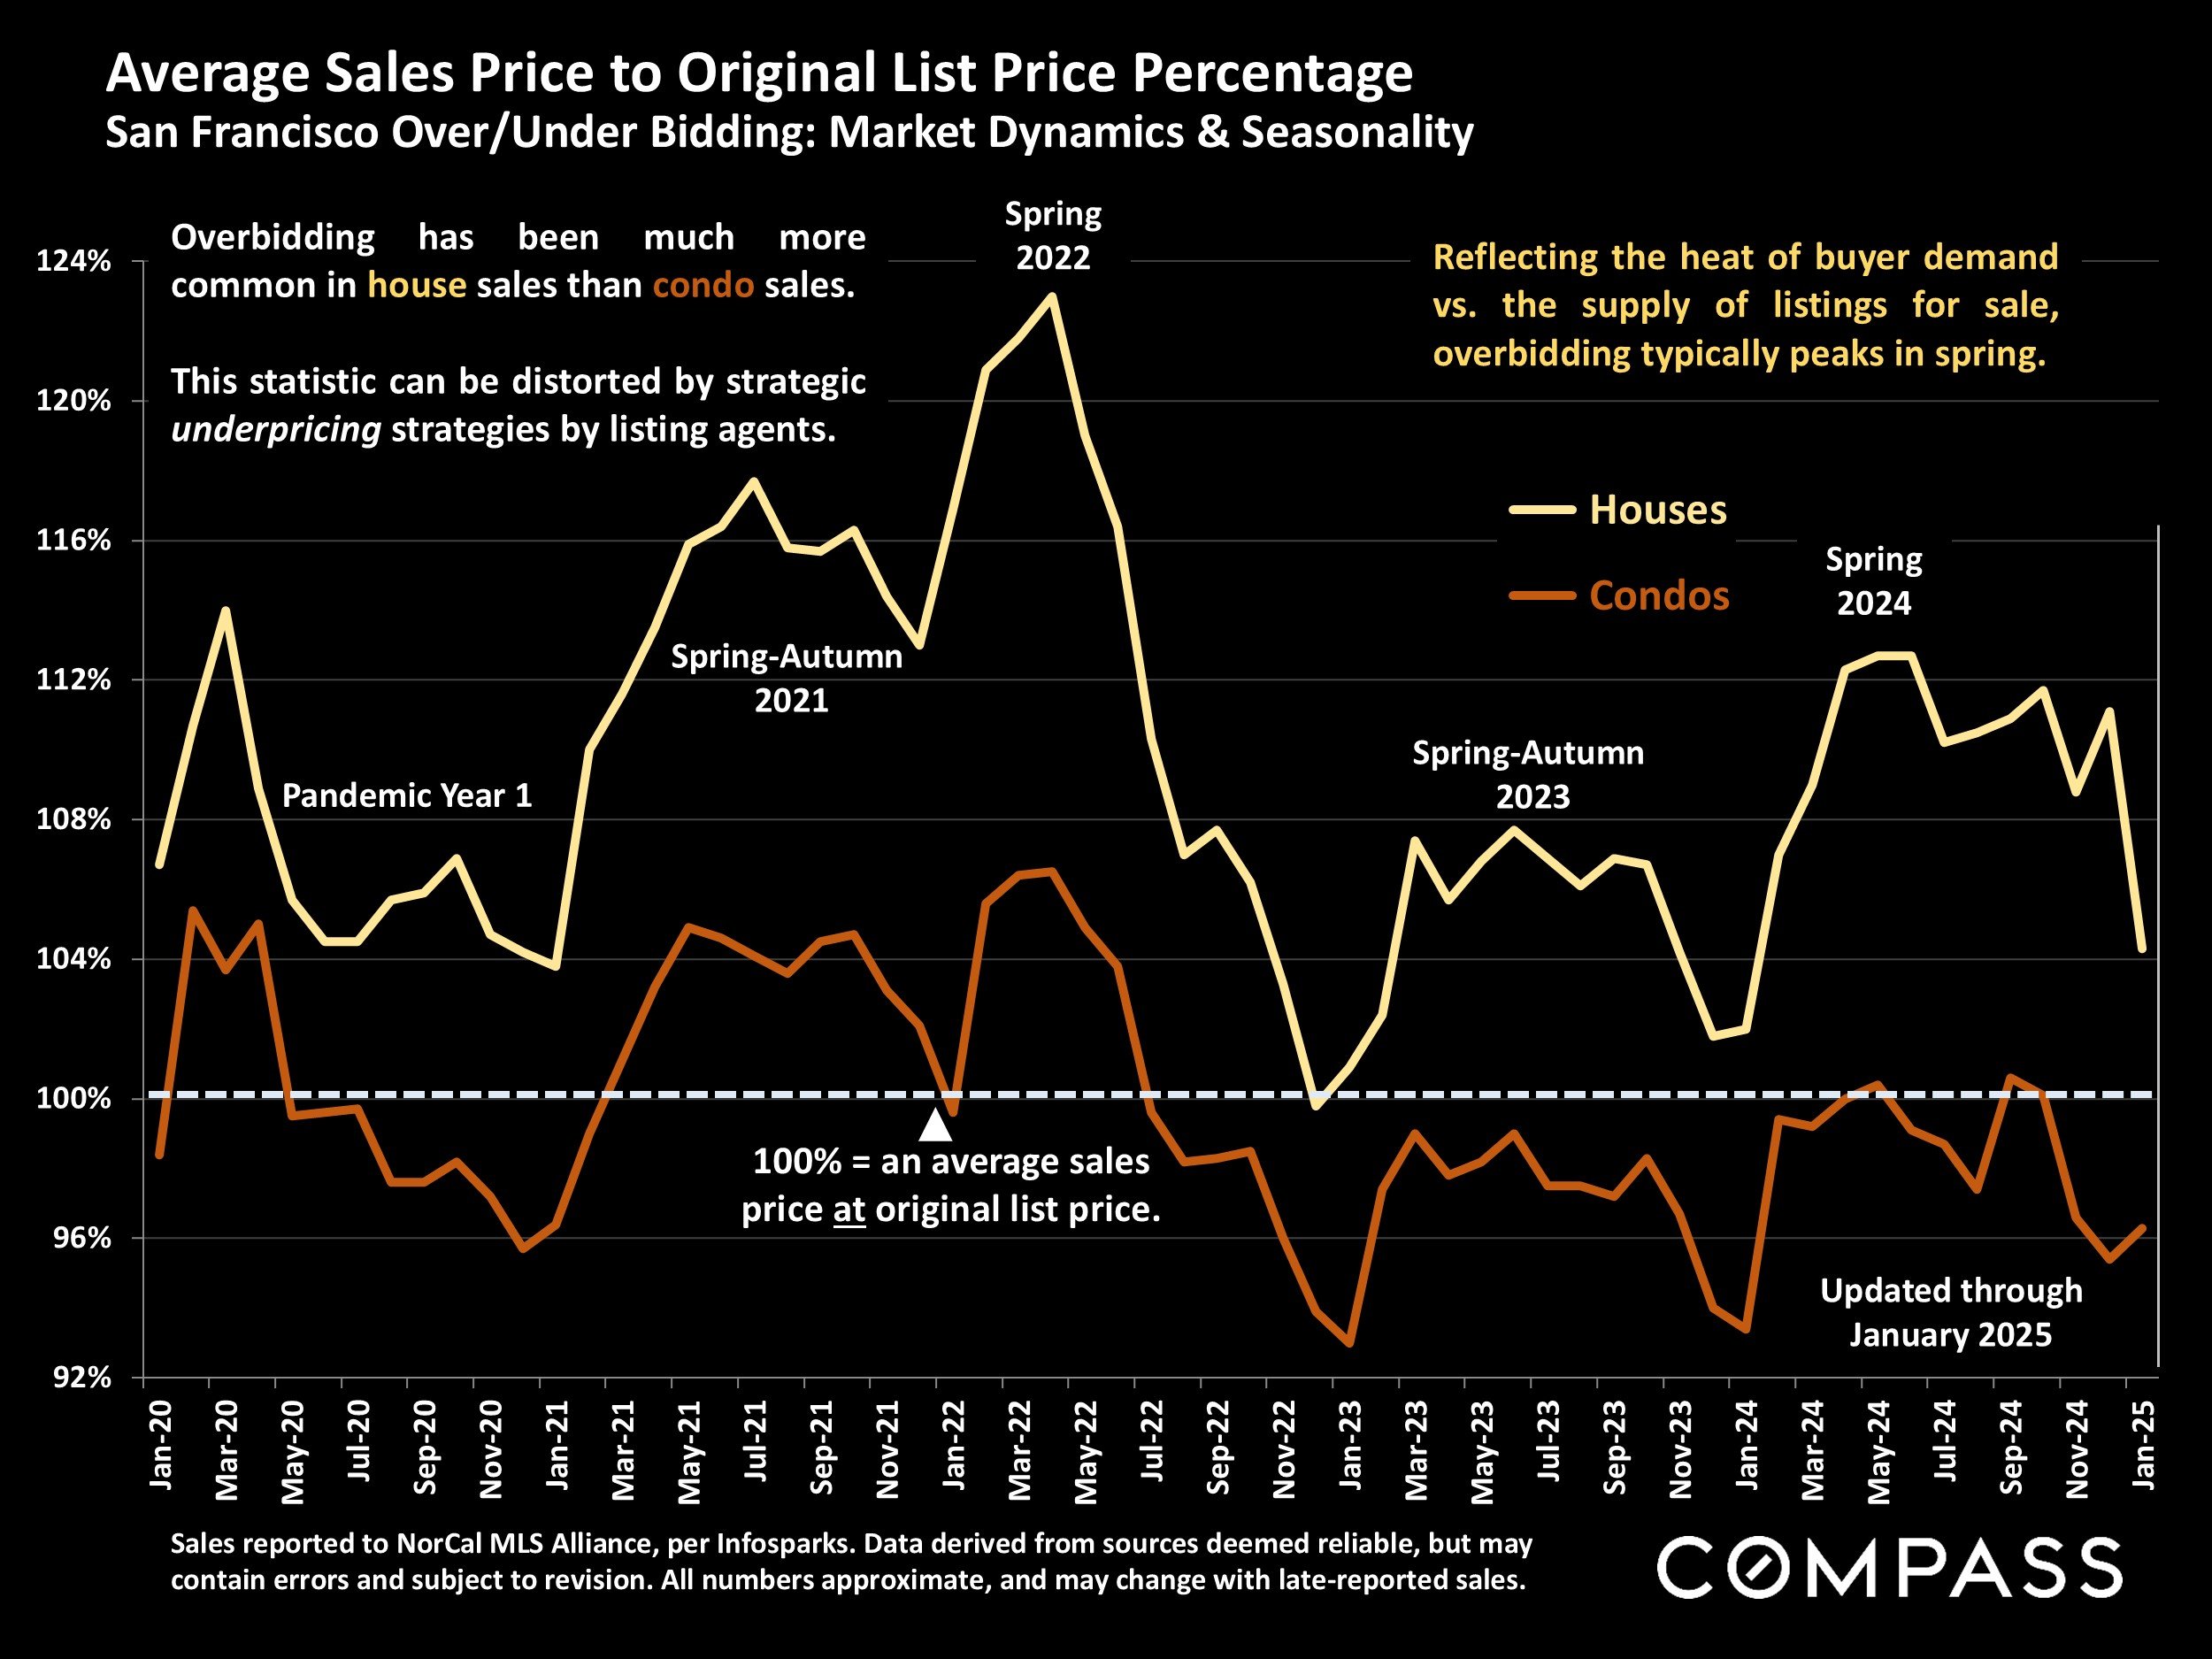
Sales reported to NorCal MLS Alliance, per Infosparks. Data derived from sources deemed reliable, but may contain errors and subject to revision. All numbers approximate, and may change with late-reported sales.
Reflecting the heat of buyer demand vs. the supply of listings for sale, overbidding typically peaks in spring.
Overbidding has been much more common in house sales than condo sales.
This statistic can be distorted by strategic underpricing strategies by listing agents.
Average Annual Home Insurance Cost for $300,000 in Coverage
Comparative Costs in Selected States, per Bankrate, January 2025*

*Per Bankrate: https://www.bankrate.com/insurance/homeowners-insurance/homeowners-insurance-cost/#cost-by-state. Rates refreshed January 2025. The average annual home insurance premium for a home with a dwelling coverage amount of $300,000. Will not include flood or earthquake insurance. Data from sources deemed reliable but may contain errors and subject to revision.
Many factors affect home insurance costs including susceptibility to natural disasters like severe weather events and fire; property construction; local construction costs; and state regulation of insurers (a big issue in CA.). Overall, rates have been rapidly accelerating with increasing damage claims, and often vary enormously between regions of the same state.
Statistics are generalities, essentially summaries of widely disparate data generated by dozens, hundreds or thousands of unique, individual sales occurring within different time periods. They are best seen not as precise measurements, but as broad, comparative indicators, with reasonable margins of error. Anomalous fluctuations in statistics are not uncommon, especially in smaller, expensive market segments. Last period data should be considered estimates that may change with late-reported data. Different analytics programs sometimes define statistics – such as “active listings,” “days on market,” and “months supply of inventory” – differently: what is most meaningful are not specific calculations but the trends they illustrate. Most listing and sales data derives from the local or regional multi-listing service (MLS) of the area specified in the analysis, but not all listings or sales are reported to MLS and these won’t be reflected in the data. “Homes” signifies real-property, single-household housing units: houses, condos, co-ops, townhouses, duets and TICs (but not mobile homes), as applicable to each market. City/town names refer specifically to the named cities and towns, unless otherwise delineated. Multi-county metro areas will be specified as such. Data from sources deemed reliable, but may contain errors and subject to revision. All numbers to be considered approximate.
Many aspects of value cannot be adequately reflected in median and average statistics: curb appeal, age, condition, amenities, views, lot size, quality of outdoor space, “bonus” rooms, additional parking, quality of location within the neighborhood, and so on. How any of these statistics apply to any particular home is unknown without a specific comparative market analysis.
Median Sales Price is that price at which half the properties sold for more and half for less. It may be affected by seasonality, “unusual” events, or changes in inventory and buying trends, as well as by changes in fair market value. The median sales price for an area will often conceal an enormous variety of sales prices in the underlying individual sales.
Dollar per Square Foot is based upon the home’s interior living space and does not include garages, unfinished attics and basements, rooms built without permit, patios, decks or yards (though all those can add value to a home). These figures are usually derived from appraisals or tax records, but are sometimes unreliable (especially for older homes) or unreported altogether. The calculation can only be made on those home sales that reported square footage.
Compass is a real estate broker licensed by the State of California, DRE 01527235. Equal Housing Opportunity. This report has been prepared solely for information purposes. The information herein is based on or derived from information generally available to the public and/or from sources believed to be reliable. No representation or warranty can be given with respect to the accuracy or completeness of the information. Compass disclaims any and all liability relating to this report, including without limitation any express or implied representations or warranties for statements contained in, and omissions from, the report. Nothing contained herein is intended to be or should be read as any regulatory, legal, tax, accounting or other advice and Compass does not provide such advice. All opinions are subject to change without notice. Compass makes no representation regarding the accuracy of any statements regarding any references to the laws, statutes or regulations of any state are those of the author(s). Past performance is no guarantee of future results.